August retail sales rose +1.2% month-over-month, blowing past the +0.8% consensus estimate. The National Retail Federation is forecasting +4.4% growth to $5.6 trillion in 2026 — well above the 3.6% ten-year average excluding the pandemic distortion. By any headline measure, the American consumer is fine.
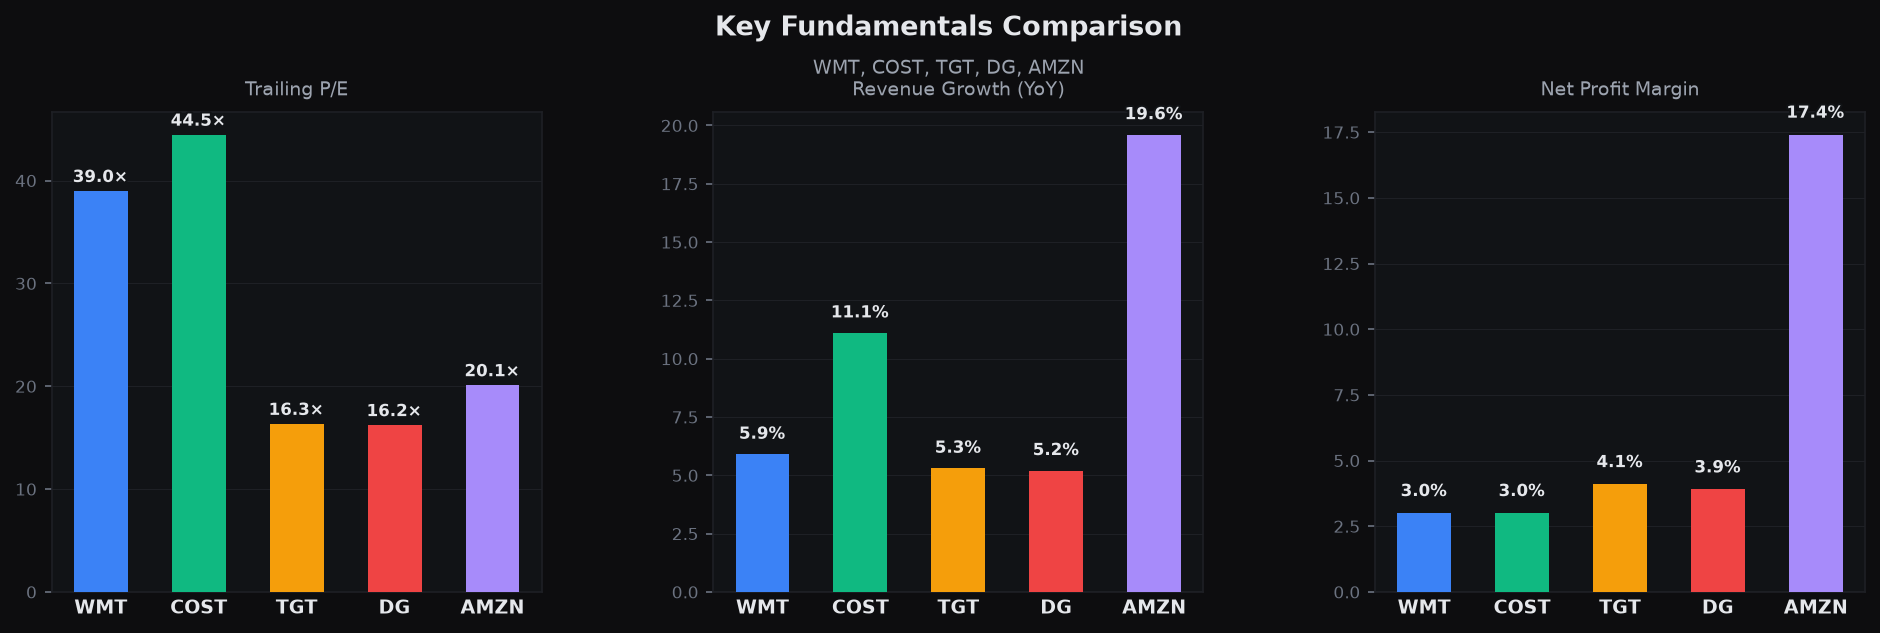
So why is the Consumer Discretionary Select Sector SPDR (XLY) sitting at $110.56, roughly 12% below its 52-week high of $125.01, with price under both its 20- and 50-day EMAs and a fresh bearish MACD crossover?
Because "the consumer" isn't one thing anymore. It's two.
The Bifurcation Is No Longer a Theory
The K-shaped economy narrative has moved from op-ed speculation to confirmed data. Bank of America's internal card spending data, Moody's Analytics consumption research, and the New York Fed have all independently documented the same split: the gap between high- and low-income spending growth widened materially starting mid-2025 and has persisted through 2026.
What makes this cycle unusual is that the aggregate numbers look healthy because of the top of the K, not despite the bottom. Two tailwinds are doing the heavy lifting, and both are concentrated:
- Wealth effects. Equity and housing appreciation accrues to households that own equities and housing — a cohort that skews heavily middle- and upper-income.
- OBBBA tax cuts, whose benefits flow disproportionately to the same cohorts now driving the marginal retail dollar.
Critically, this isn't a credit-fueled binge. Total US household debt was $18.8 trillion in Q2 2026, down $13 billion quarter-over-quarter — essentially flat, a rounding error. That supports a "resilient but selective" read rather than a consumer levering up into a cliff. The spending is real. It's just narrow.
What the Earnings Are Actually Saying
The retail earnings tape tells the bifurcation story more honestly than the Census print.
COST reported Q4 FY26 on September 24 with EPS of $6.75 versus roughly $6.55 estimated — a clean beat, supported by broad membership strength and the kind of high-income trade patterns that have made warehouse clubs the single best proxy for upper-cohort resilience. Shares popped +2.93% on the print to $922.77, though the stock remains 16% below its 52-week high of $1,096.50.
Then there's DG, which raised FY26 guidance to net sales growth of 4.0–4.3%, comps of 2.5–2.9%, and EPS of $7.80–$8.00. On the surface, that reads as low-income strength. It isn't. Dollar General's raise was driven by trade-down from higher-income shoppers offsetting continued stress in its traditional core customer base.
Management's own framing is the most important soundbite of the cycle: households earning $100,000 no longer "feel" high-income given inflation and gas costs. That is a value retailer telling you its upside is coming from people who used to shop somewhere else — not from its base getting healthier.
That distinction matters enormously. A beat driven by trade-down is a beat built on other retailers' lost traffic.
The Market Is Already Pricing This
Look at the technical divergence across the complex:
| Ticker | Price | Setup |
|---|---|---|
| XLY | $110.56 | Bearish: 20 EMA < 50 EMA, RSI 41, bearish MACD crossover, -12% from highs |
| WMT | $107.98 | RSI 49; bearish EMA trend, bullish MACD crossover |
| TGT | $157.45 | Bullish EMA trend (20 > 50) |
| DG | $124.84 | Bullish EMA trend |
| AMZN | $249.67 | Bullish EMA trend, bearish MACD crossover |
The sector ETF is breaking down while the value and mega-cap constituents hold up. That's not a market rejecting consumption — it's a market repricing which kind of consumption survives.
On Walmart specifically: the consensus rating is "Buy" with an average analyst price target of $127.42, implying roughly 18% upside (analyst estimate, not a guarantee). But the PEG ratio sits at an elevated 4.13 — a lot of that defensive premium is already paid for. Walmart's most recent Q2 print delivered EPS of $0.81 versus $0.74 estimated, a 9.3% beat.
Meanwhile the VIX at 14.87 (-5.1%) suggests the broader market is not pricing consumer risk aggressively at all. That's complacency, not confirmation.
The Margin Story Nobody Is Modeling
Even if the top line holds, three cost pressures are building underneath it:
Energy as a regressive tax. The Iran conflict has pushed oil and gas costs higher heading into the holiday quarter. Fuel inflation hits the bottom of the K hardest and arrives exactly when discretionary budgets are set. The conflict has also created direct operational risk for Amazon, with confirmed drone strikes hitting AWS data centers.
Shrink and organized retail theft are re-emerging as a margin narrative across Walmart, Target, and CVS — a cost headwind entirely independent of demand.
Self-imposed wage inflation. Amazon raised its operations minimum wage to $20/hour and added a Whole Foods discount; Walmart is funding upskilling programs. Tight labor is good for consumer spending and bad for retailer operating margins simultaneously.
The Calendar That Decides It
- Oct 2 — September jobs report. Labor cooling is the swing factor for both Fed policy and confidence.
- Oct 14 — CPI, with the first clean read on Iran-driven energy pass-through.
- Oct 28–29 — FOMC decision and PCE.
- Nov 19 — Walmart Q3 earnings, the best single read across value and discretionary categories.
- Dec/Jan — Holiday sell-through via NRF and Mastercard SpendingPulse.
One caveat on the data itself: preliminary September retail sales reads are conflicting, with some outlets showing modest cooling near +0.2% or an outright pullback, complicated by the earlier government shutdown delay. Treat that print as provisional and watch the revision.
The positioning takeaway: the relative performance of staples and value over discretionary is a more honest signal than any single headline retail sales number. Aggregate resilience is a statistical average hiding a two-speed economy — and averages are precisely what break first when the bottom of the K stops absorbing.
This article is for informational purposes only and does not constitute financial advice. Always conduct your own research before making investment decisions.